cataclysmic variables
an observational foray
Cataclysmic variables (CVs) are binary systems consisting of an accreting white dwarf (AWD) along with a mass-transferring, Roche-lobe filling secondary star. CVs can be both magnetic and non-magnetic, with the classification depending on whether or not the magnetic field of the white dwarf is enough to control the accretion flow. If the accretion process continues till the white dwarf reaches close to the Chandrasekhar limit, the process may lead to a runaway carbon fusion and trigger a Type Ia supernova explosion which destroys the white dwarf.
There are a few anomalous magnetic CVs that are classified as asynchronous polars. An asynchronous polar shows all the physical properties of a polar system but with a slight mismatch (< 1%) in their spin and orbit period. One of the most common theories for the origin of this asynchronicity is that the system was previously synced up until a nova explosion broke up this synchronicity by changing the white dwarf’s rotation period. One such source, BY Cam, was studied in this project.
BY Cam is an asynchronous polar system, located at celestial coordinates 𝛼 = 05: 43: 48.8015, 𝛿 = 60: 51: 31.37, at a distance of 264.5 pc. It has a slight mismatch between its spin and orbit periods – with a spin period of 𝑃𝑠𝑝𝑖𝑛 = 11963.04 𝑠 and orbit period 𝑃𝑜𝑟𝑏𝑖𝑡 = 12074.64 𝑠.The data analyzed in this project was taken from a ~ 30 ks NuSTAR observation made between 12th and 13th November 2018. Analysis was done using imaging, spectral, and timing techniques using toold from NASA’S high energy astrophysics software, HEASOFT.
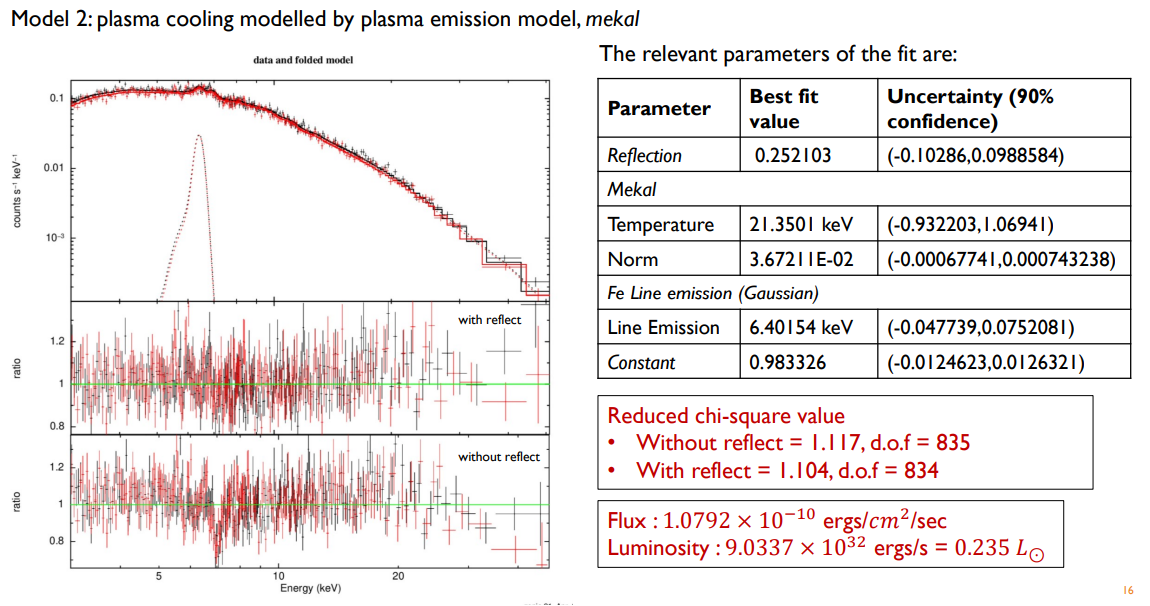
Timing analysis, done using epoch folding, indicated a one-pole accretion in the system. Spectral analysis was done by modelling the NuSTAR X-Ray spectrum using various physical processes - including post-shock plasma cooling through brehmsstrahlung, compton reflection, and ISM absorption. Alternate cooling models, like mekal, were also used. Through the spectral analysis, we obtained a lower bound on the white dwarf mass as close to 0.6 Msol. The flux and luminosity of the source were also estimated.

This is a brief description of work I did as part of IISc’s Astronomical Techniques course, under the supervision of Prof. Vikram Rana. Spectral fitting graph generated using HEASOFT. CV accretion diagram courtesy of NASA.